
Archi-Flow
Visualize cloud architecture with live traffic simulations
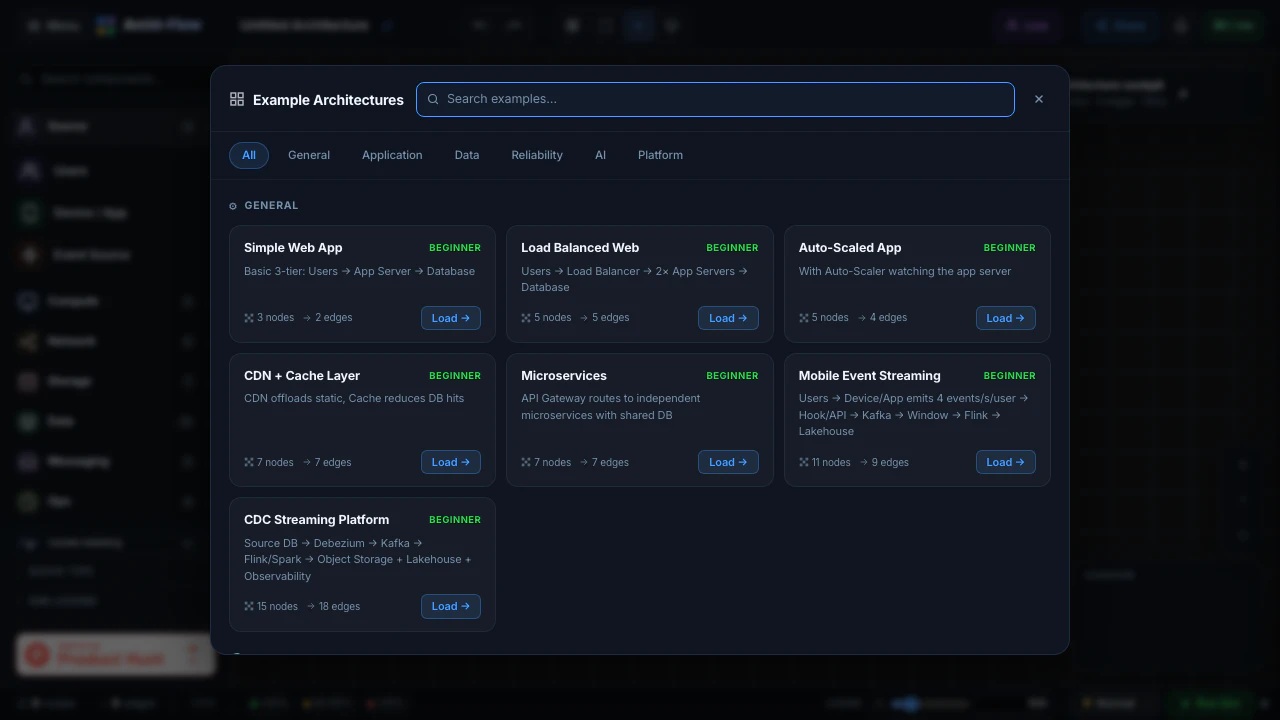
Archi-Flow brings your cloud architecture to life. Instead of looking at static diagrams, you can design interactive cloud architecture maps featuring real-time live traffic simulations. Perfect for system design reviews, debugging data flows, onboarding engineers, and presenting complex architectures with clarity. Built to bridge the gap between design and reality.
AI Analysis
Archi-Flow transforms static cloud architecture diagrams into interactive maps with real-time live traffic simulations. Core features include designing dynamic visualizations, simulating data flows, and using them for system design reviews, debugging, onboarding engineers, and presentations. It solves key pain points such as misalignment between documented architectures and actual runtime behavior, difficulty in communicating complex systems, and limited insights from static tools. Unique selling point is bridging the gap between design and operational reality. Overall value proposition is delivering clarity, improved collaboration, and efficiency in managing and presenting cloud infrastructures.
In 2025-2026, cloud complexity continues to grow with widespread microservices, Kubernetes, and multi-cloud adoption. Observability and AI-driven operations are rising trends, increasing demand for dynamic visualization tools beyond static diagrams. Real-time tech is mature and user needs for better debugging/onboarding tools are strong amid talent shortages. Favorable economic push for efficiency tools. This is Excellent Timing.
Technical difficulty is medium due to requirements for cloud provider API integrations to enable live traffic data. Development and operation costs are moderate for a SaaS real-time simulation engine. Supply chain risks are low; data compliance (e.g. GDPR) is a consideration but manageable. Strong scalability potential as a web tool. High feasibility assuming a team experienced in cloud and visualization tech. Rating: High.
Main segments: Cloud architects, DevOps/SRE engineers, engineering managers aged 28-45 in tech/SaaS/fintech enterprises. Industries: Software development and IT services. Geographic: Primarily North America and Europe with global remote users. Estimated market size: TAM ~$8B (cloud management/visualization tools), SAM ~$1.5B (architecture diagramming), SOM ~$150M (interactive simulation niche). Core pain points: Static diagrams failing to capture live behavior and poor cross-team visibility. High willingness to pay for productivity gains via subscription pricing.
Competition level: Medium. Direct competitors: 1. Hava (hava.io) - automated cloud diagrams from live environments. 2. Cloudcraft (cloudcraft.co) - 3D AWS architecture modeling. 3. Lucidchart (lucid.co) - collaborative diagramming with data linking. 4. Draw.io / diagrams.net - free static/flow diagrams. Advantages: Superior live traffic simulation and interactivity for reviews/debugging not emphasized by competitors. Disadvantages: Newer entrant may lack automation depth, established ecosystems, or breadth of cloud integrations; pricing not specified but could face pressure if premium.
Upgrade Pro to unlock full AI analysis
Similar Products

Opaline
PostHog for team Claude Code and Codex sessions.
▲ 141 votes

React UI Kit V7
All the chat components you need. None of the complexity
▲ 115 votes

Coarena by Coasty
The arena where agents battle on real-world work
▲ 104 votes

Replay QA Security Scan
Automated Penetration Testing for AI-Built Apps
▲ 102 votes

Audryo
Customer email your agent can operate.
▲ 68 votes

Refoid
Automate App Store refund responses and track every outcome
▲ 68 votes