
Autoplot
Unify data analysis and plotting in one powerful workspace
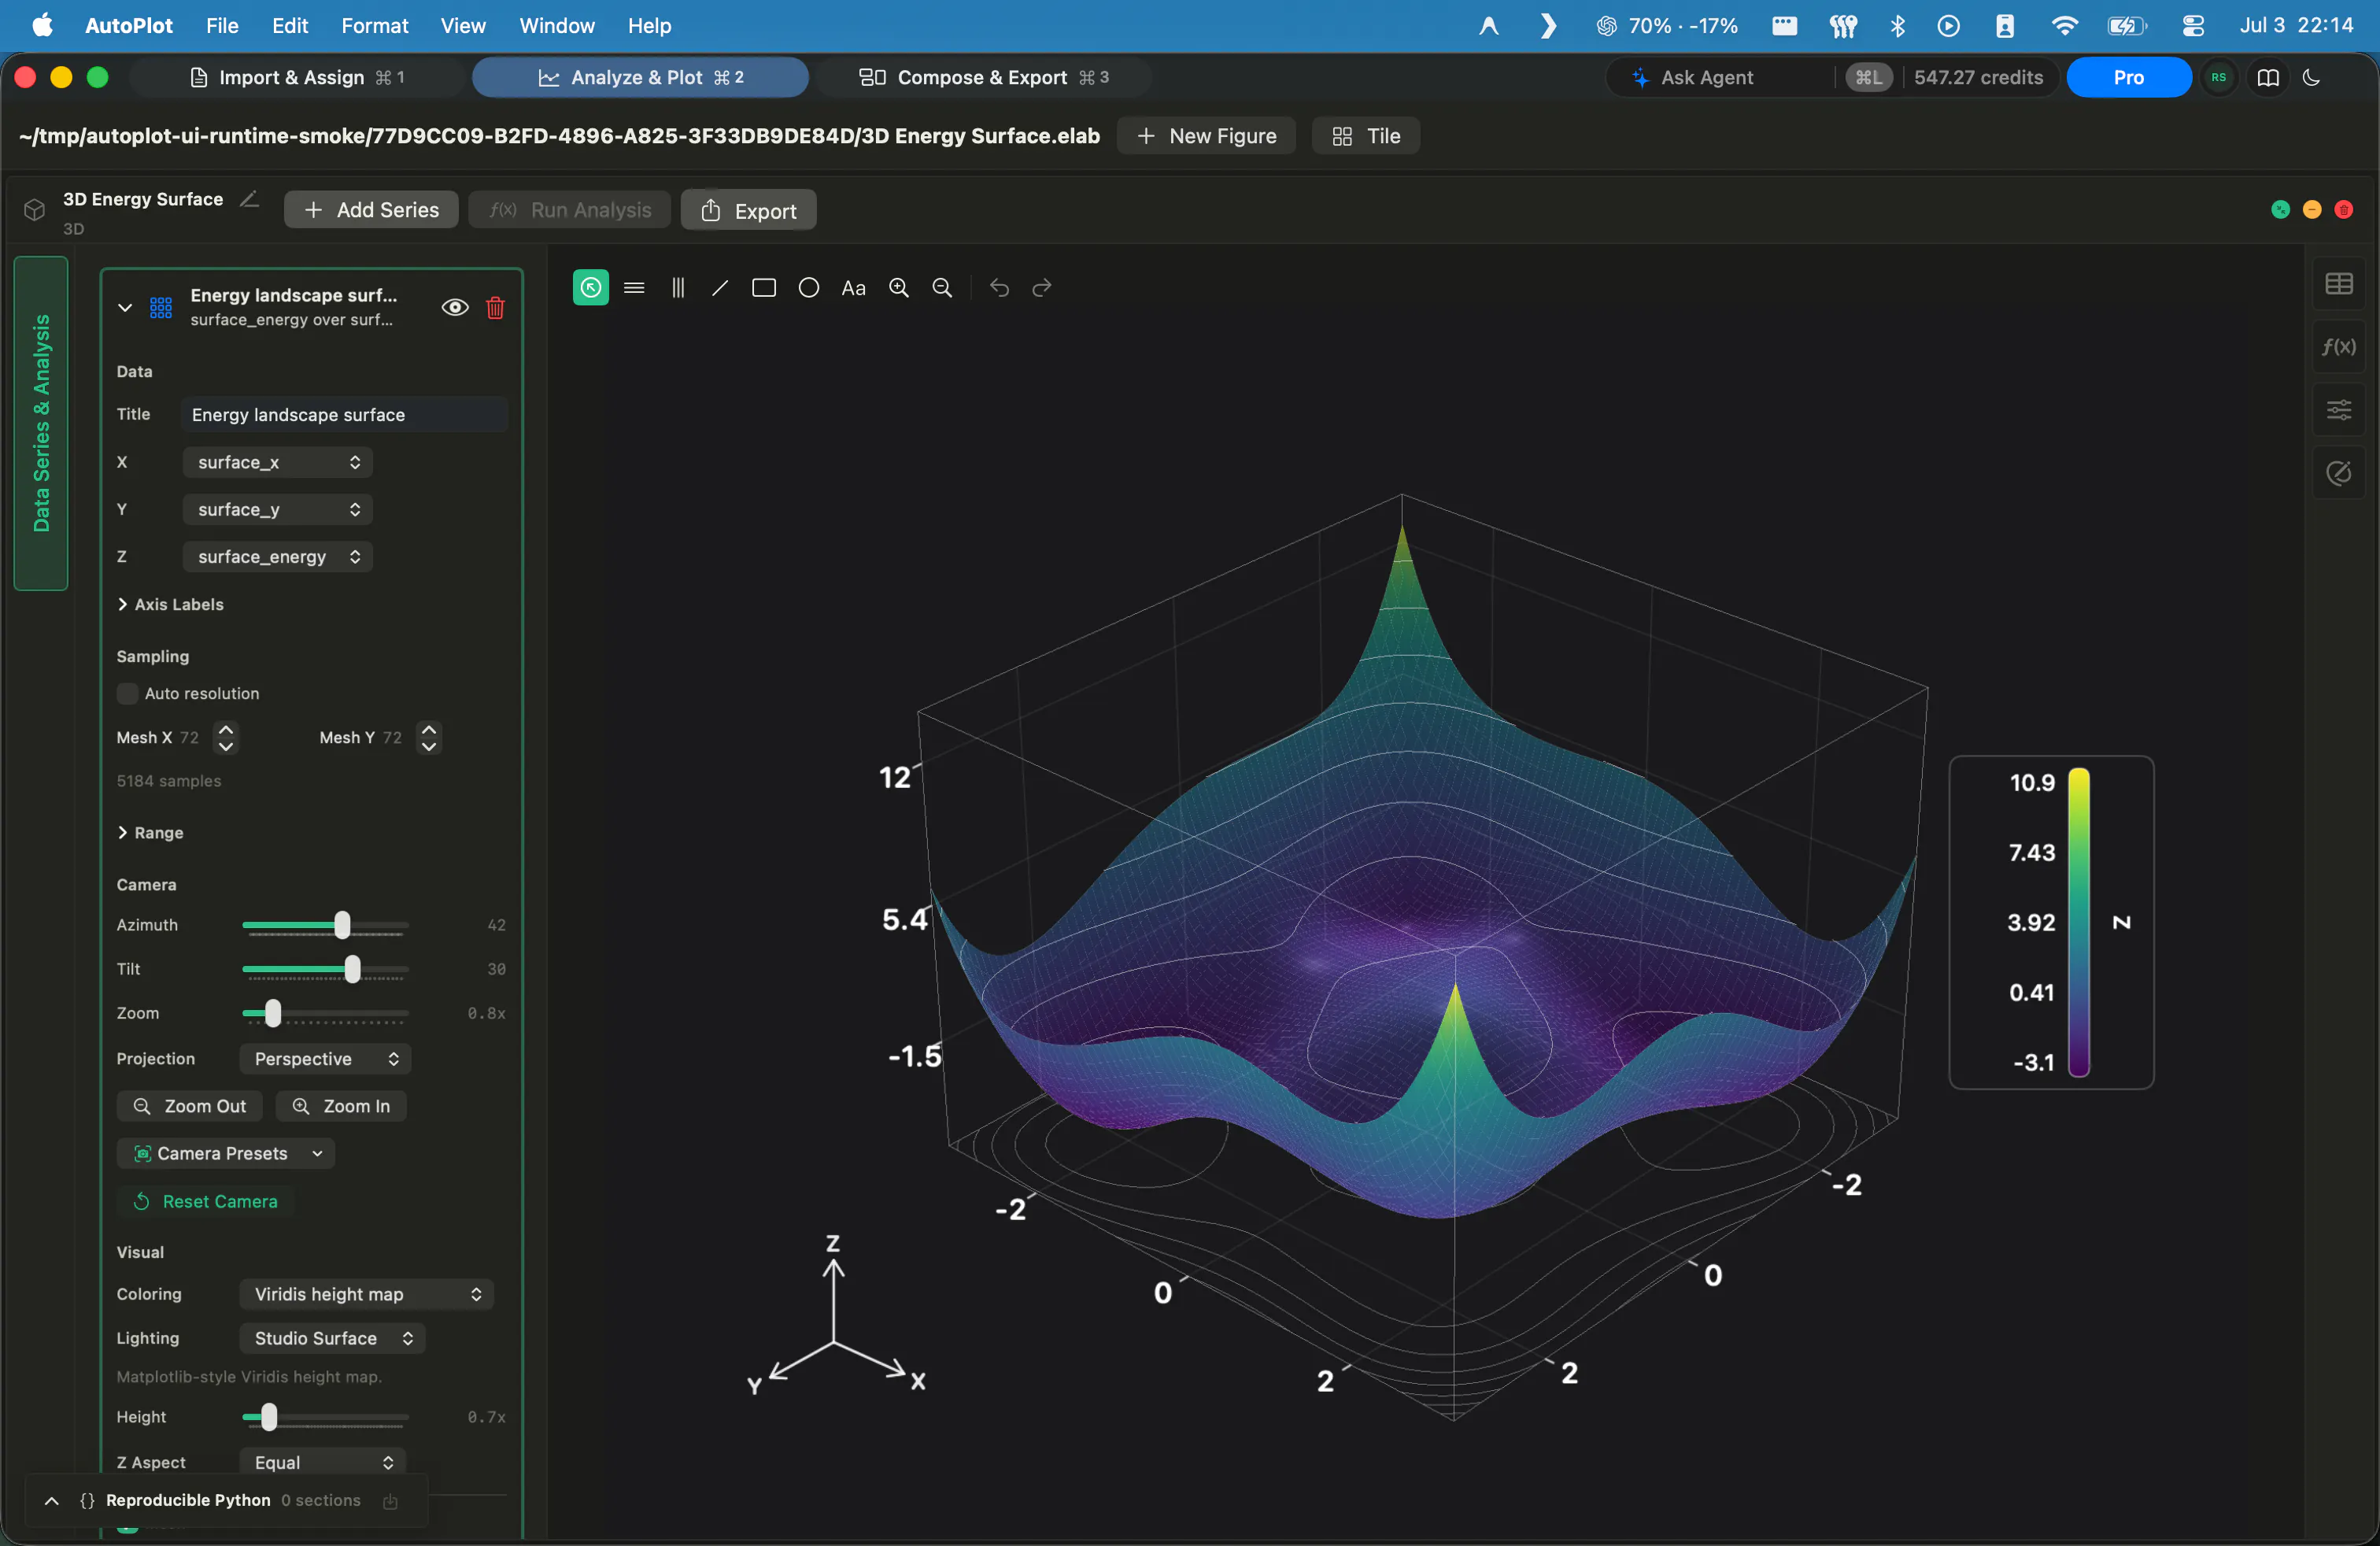
AutoPlot is a Mac native scientific workspace for plotting and exploratory data analysis. Import tabular datasets, create variables, build X&Y plots, histograms, heat maps, correlations, 3D plots, and charts, run fits, then compose figures with vector export. Metal-backed GPU rendering keeps 3D scenes and correlation networks interactive at full dataset size — rotate, zoom, and re-fit without waiting on a redraw. Raw data values never leave your Mac.
AI Analysis
AutoPlot is a native Mac scientific workspace unifying data analysis and visualization. Core features include importing tabular datasets, creating variables, generating XY plots, histograms, heat maps, correlations, 3D plots, running fits, and composing vector-exportable figures. Unique selling points are Metal-backed GPU rendering for lag-free interactivity with full datasets and strict data privacy—all processing stays local on the Mac. It solves key pain points like sluggish performance in traditional tools for large datasets, fragmented workflows between analysis and plotting apps, and security risks from cloud solutions. The value proposition is a fast, private, all-in-one environment for researchers to explore data and create publication-quality visuals efficiently.
In 2025-2026, with growing data science demands, mature Apple Silicon GPUs enabling high-performance local apps, rising privacy concerns, and shift toward on-device computing amid AI advancements, timing is strong. Researchers need efficient, secure tools avoiding cloud latency or data leaks, aligning well with Autoplot's strengths. The scientific software market remains stable with room for specialized native tools. Rating: Excellent Timing.
Technical difficulty is high for GPU-accelerated 3D rendering, correlation networks, and scientific fitting, but Apple's mature Metal framework and the product's demonstrated capabilities reduce risk. Dev/operation costs are medium for a desktop app with no server infrastructure. Low supply chain/compliance risks (software-only, privacy-focused). Strong scalability on Mac hardware and good team fit for scientific computing experts. Overall rating: High.
Primary segments: Mac-using scientists, researchers, and data analysts in academia, biotechnology, physics, chemistry, and engineering R&D. Geographically concentrated in North America, Europe, with growing Asia presence. Scientific data visualization market has substantial demand; users face pain points of slow large-dataset tools, disjointed analysis-to-figure workflows, and privacy issues. High willingness to pay for specialized, time-saving professional software that produces publication-ready outputs.
Competition level: Medium. Direct competitors: 1. GraphPad Prism (graphpad.com), 2. OriginPro (originlab.com), 3. Igor Pro (wavemetrics.com), 4. MATLAB (mathworks.com). Advantages vs competitors: native Mac optimization with superior GPU-driven interactivity at full dataset scale, uncompromising local privacy, and seamless unified workspace. Disadvantages: macOS-only (vs cross-platform rivals), potentially fewer accumulated specialized stats/features than veteran tools, and smaller established user community as a newer entrant.
Upgrade Pro to unlock full AI analysis
Similar Products

Adapt
The company brain that gets work done
▲ 124 votes

Tapfree for Chrome
Voice dictation that adapts to what’s on your screen
▲ 122 votes

Kosshi
Simple, fast outliner for Mac and iPhone.
▲ 90 votes

Thoughts for Mac
Capture notes from your menubar using text, images or voice
▲ 90 votes

WikiFix for Confluence
Find and fix issues in your knowledge base
▲ 86 votes

Refoid
Automate App Store refund responses and track every outcome
▲ 68 votes