
Databerry
Track all your business data in a single dashboard
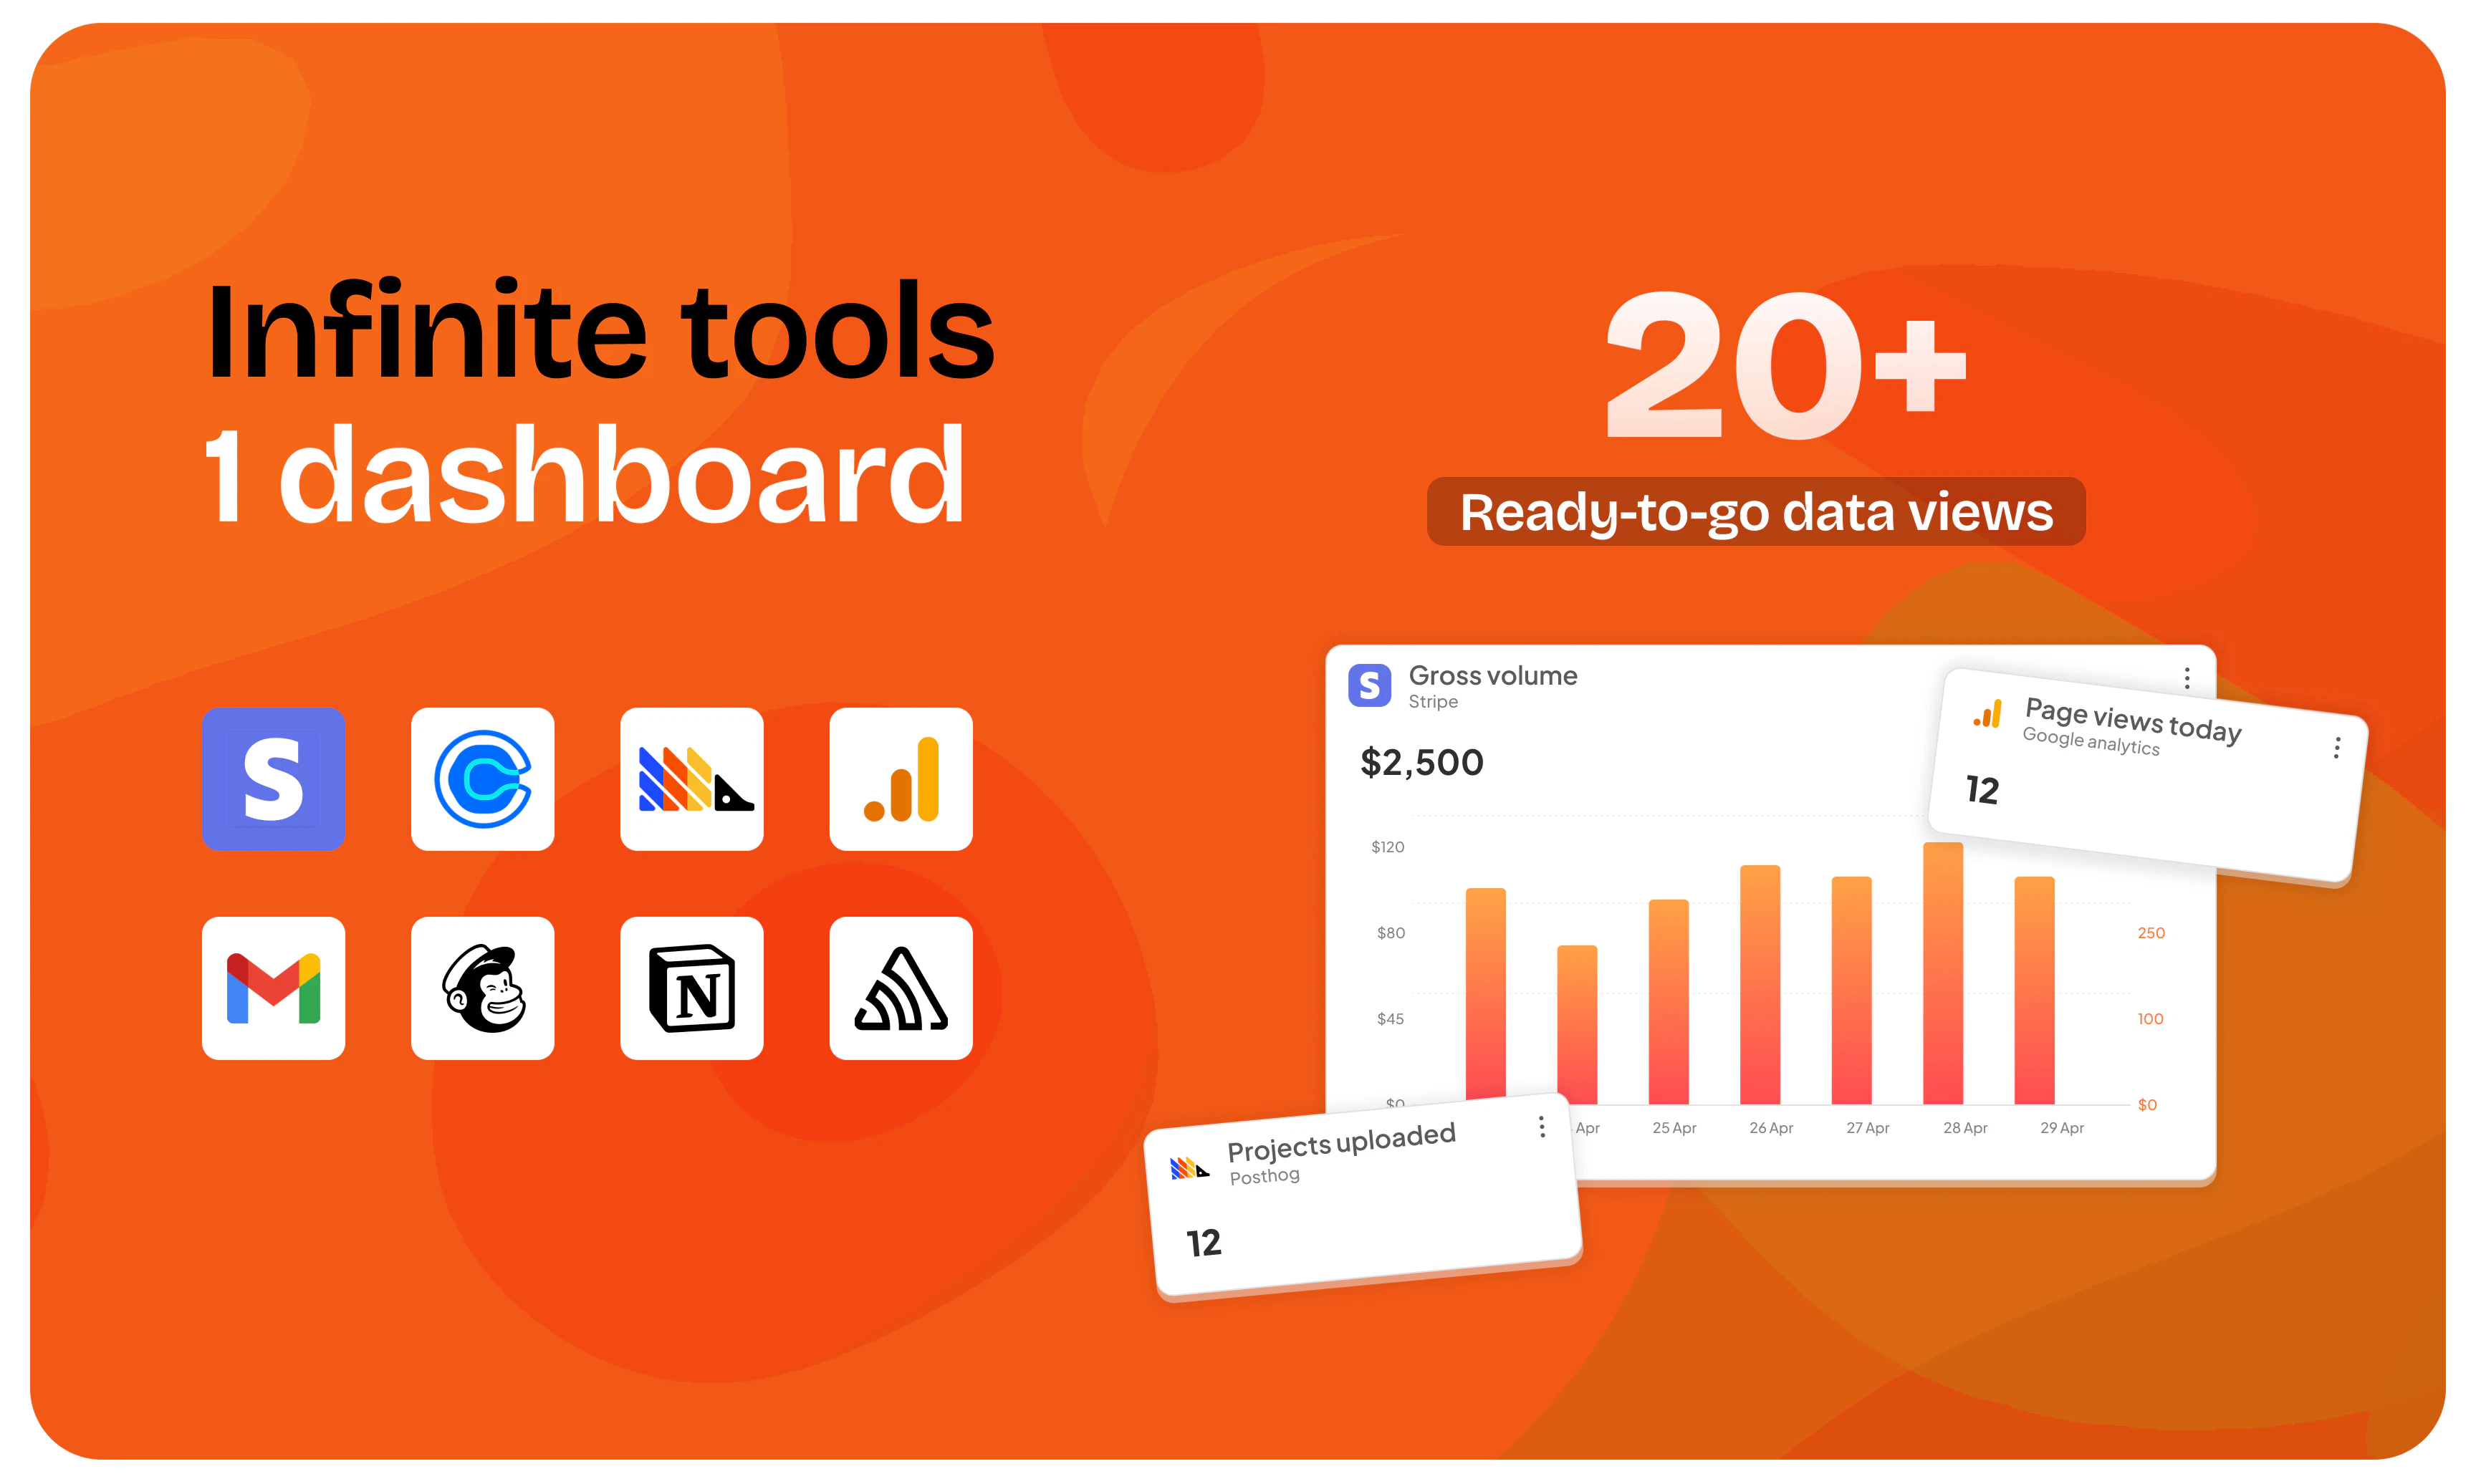
Track revenue, analytics, meetings, and more from a single dashboard. Connect Stripe, PostHog, Calendly and other tools in minutes.
AI Analysis
Databerry is a unified analytics dashboard that consolidates key business metrics like revenue, product analytics, meetings, and more into one interface. It connects seamlessly with tools such as Stripe, PostHog, Calendly, and others in minutes via API integrations. Core features focus on real-time tracking and eliminating the need to switch between platforms. It solves the pain of fragmented data sources and time-consuming manual reporting for busy teams. The value proposition is simplicity, speed of setup, and providing a holistic business overview to enable faster, data-driven decisions for small teams and startups.
In 2025-2026, with increasing SaaS tool adoption, maturing API ecosystems, and growing demand for no-code analytics among startups, the timing is favorable for unified dashboards. However, BI and integration tools have been popular for years, with AI enhancements raising user expectations. Economic focus on efficiency supports demand. Overall: Moderate Timing.
API integrations are technically straightforward but require ongoing maintenance for updates and reliability. Development and operation costs are medium due to cloud hosting and support needs. Low supply chain or compliance risks for a SaaS tool. High scalability potential via modern cloud services. Team with API experience would fit well. Overall rating: High.
Primary users: Startup founders, small SaaS/business teams, indie hackers, and growth managers (typically 25-40 years old, tech-savvy). Industries: Software, e-commerce, digital services. Geographic: Global, with heavy concentration in US and Europe. TAM for business analytics dashboards exceeds $15B; SAM for multi-tool integrators around $2B; SOM for early adopters ~$100M+. Core pains: Disconnected metrics and inefficient oversight. High willingness to pay for time-saving subscription tools ($10-99/mo).
Competition level: Medium. Direct competitors: 1. Databox (databox.com), 2. Geckoboard (geckoboard.com), 3. Cyfe (cyfe.com), 4. Whatagraph (whatagraph.com), 5. Klipfolio/PowerMetrics (klipfolio.com). Advantages: Quick setup focused on popular startup tools (PostHog, Calendly), clean single-dashboard approach. Disadvantages: Likely fewer advanced visualization/customization options and brand recognition than established platforms; newer entrant faces challenges in feature depth and integrations.
Upgrade Pro to unlock full AI analysis
Similar Products

Equitybee Benchmark
Compare your startup equity grant for free.
▲ 218 votes

LemonLime
Automates your existing workflows with a single prompt.
▲ 152 votes

Opaline
PostHog for team Claude Code and Codex sessions.
▲ 141 votes

Coarena by Coasty
The arena where agents battle on real-world work
▲ 104 votes

Figo
See every move your competitors make
▲ 95 votes

DecisionBox for Databricks
Connect DecisionBox to your Databricks to validate findings
▲ 72 votes