
Globestudio
Open-source dotted maps and 3D globes for designers
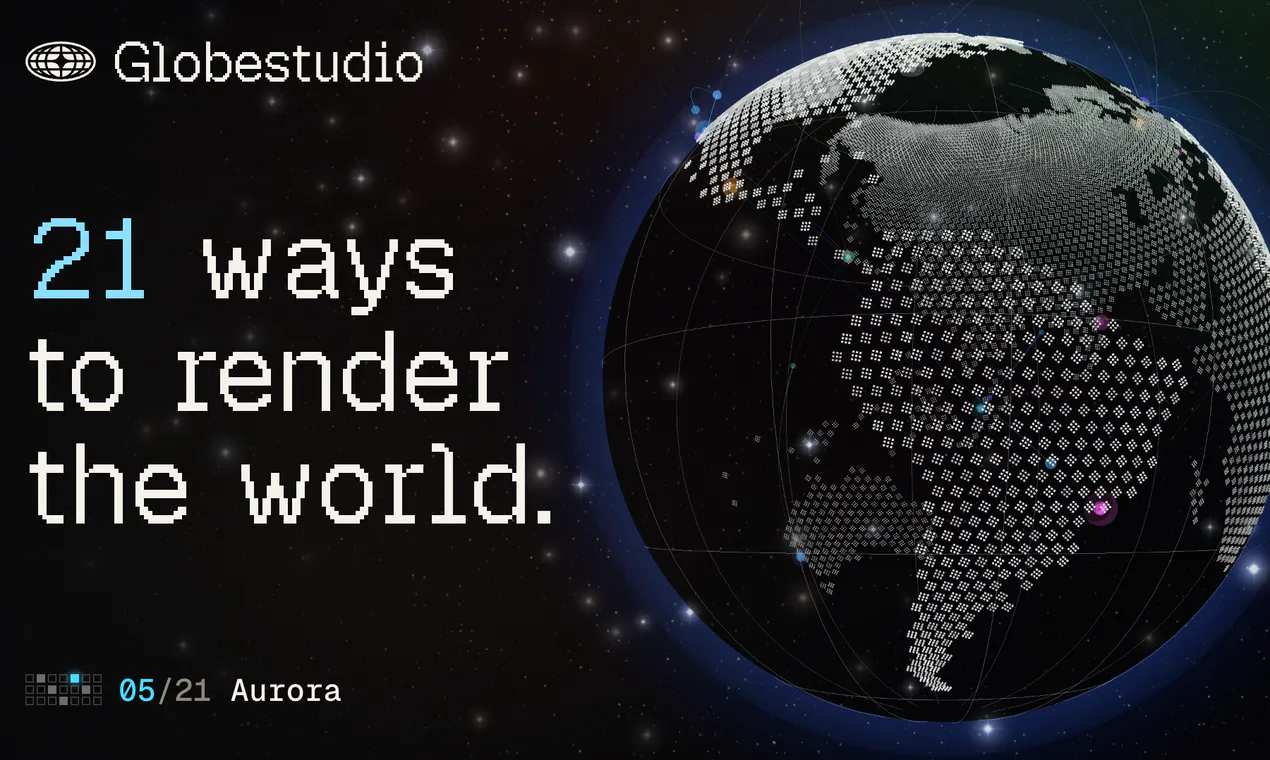
A free, open-source studio for dotted maps and 3D globes. Pick the world or any country, choose one of 21 shader looks, tweak the dots, gradients and density, then export a PNG, SVG, WebM, MP4 or GIF, or embed it live. It's MIT licensed, with no account.
AI Analysis
Globestudio is a free, open-source tool for creating customized dotted maps and 3D globes. Core features include selecting global or country-specific views, applying one of 21 shader styles, adjusting dots, gradients, and density, with outputs in PNG, SVG, WebM, MP4, GIF, or live embeds. Unique selling points are its MIT license, no-account accessibility, and designer-friendly interface. It solves pain points like the complexity and cost of professional design or GIS software for creating geographic visualizations, enabling quick, high-quality outputs for web, presentations, and reports. Overall value proposition: democratizes artistic 3D mapping for designers and developers.
Favorable for 2025-2026 due to maturing WebGL/3D web technologies, rising demand for engaging data visualizations in AI-driven content, digital marketing, and education sectors. Open-source tools align with growing developer preference for free, privacy-focused solutions amid economic pressures. User demand for quick, embeddable visuals is increasing with remote collaboration and social sharing trends. Not saturated yet in the artistic dotted globe niche. Rating: Excellent Timing.
High technical feasibility using established web technologies (likely WebGL/shaders). Low development and operation costs as an open-source project with no user accounts or servers needed for core use. Minimal supply chain or compliance risks (MIT license). Strong scalability for embedding and community contributions. Team fit high for developers familiar with 3D rendering. Main risk is limited monetization as fully free. Rating: High.
Main segments: Graphic/UI designers, frontend developers, data journalists, educators, and marketers (ages 25-45, tech-savvy). Industries: Design, software development, media/publishing, education. Geographic: Global with concentration in US, Europe, and East Asia. Estimated market: Data visualization TAM large (billions), SAM for web-based design tools hundreds of millions, SOM for this niche smaller. Core pain points: Time and expertise needed for custom maps in tools like Adobe Illustrator or complex GIS. Willingness to pay: Moderate; many prefer free but may pay for advanced features/support.
Low. Direct competitors: 1. Globe.GL (https://globe.gl/), 2. Kepler.gl (https://kepler.gl/), 3. Flourish Maps (https://flourish.studio/), 4. Mapbox GL JS examples (https://www.mapbox.com/), 5. Observable Plot (https://observablehq.com/). Advantages: Specialized artistic dotted/shader styles, broader export formats (including video/GIF), completely free with no signup, easy UI for non-coders. Disadvantages: Potentially fewer data integration options than Kepler.gl or Mapbox; as open-source, may lack dedicated enterprise support. Strong differentiation in designer-focused, aesthetic globes vs data-heavy competitors.
Upgrade Pro to unlock full AI analysis
Similar Products

Opaline
PostHog for team Claude Code and Codex sessions.
▲ 141 votes

React UI Kit V7
All the chat components you need. None of the complexity
▲ 115 votes

Replay QA Security Scan
Automated Penetration Testing for AI-Built Apps
▲ 102 votes

CodeBurn
See where your AI coding spend actually goes
▲ 101 votes

Refoid
Automate App Store refund responses and track every outcome
▲ 68 votes

Audryo
Customer email your agent can operate.
▲ 0 votes