witr
Why is this running? Trace process, port, container or file
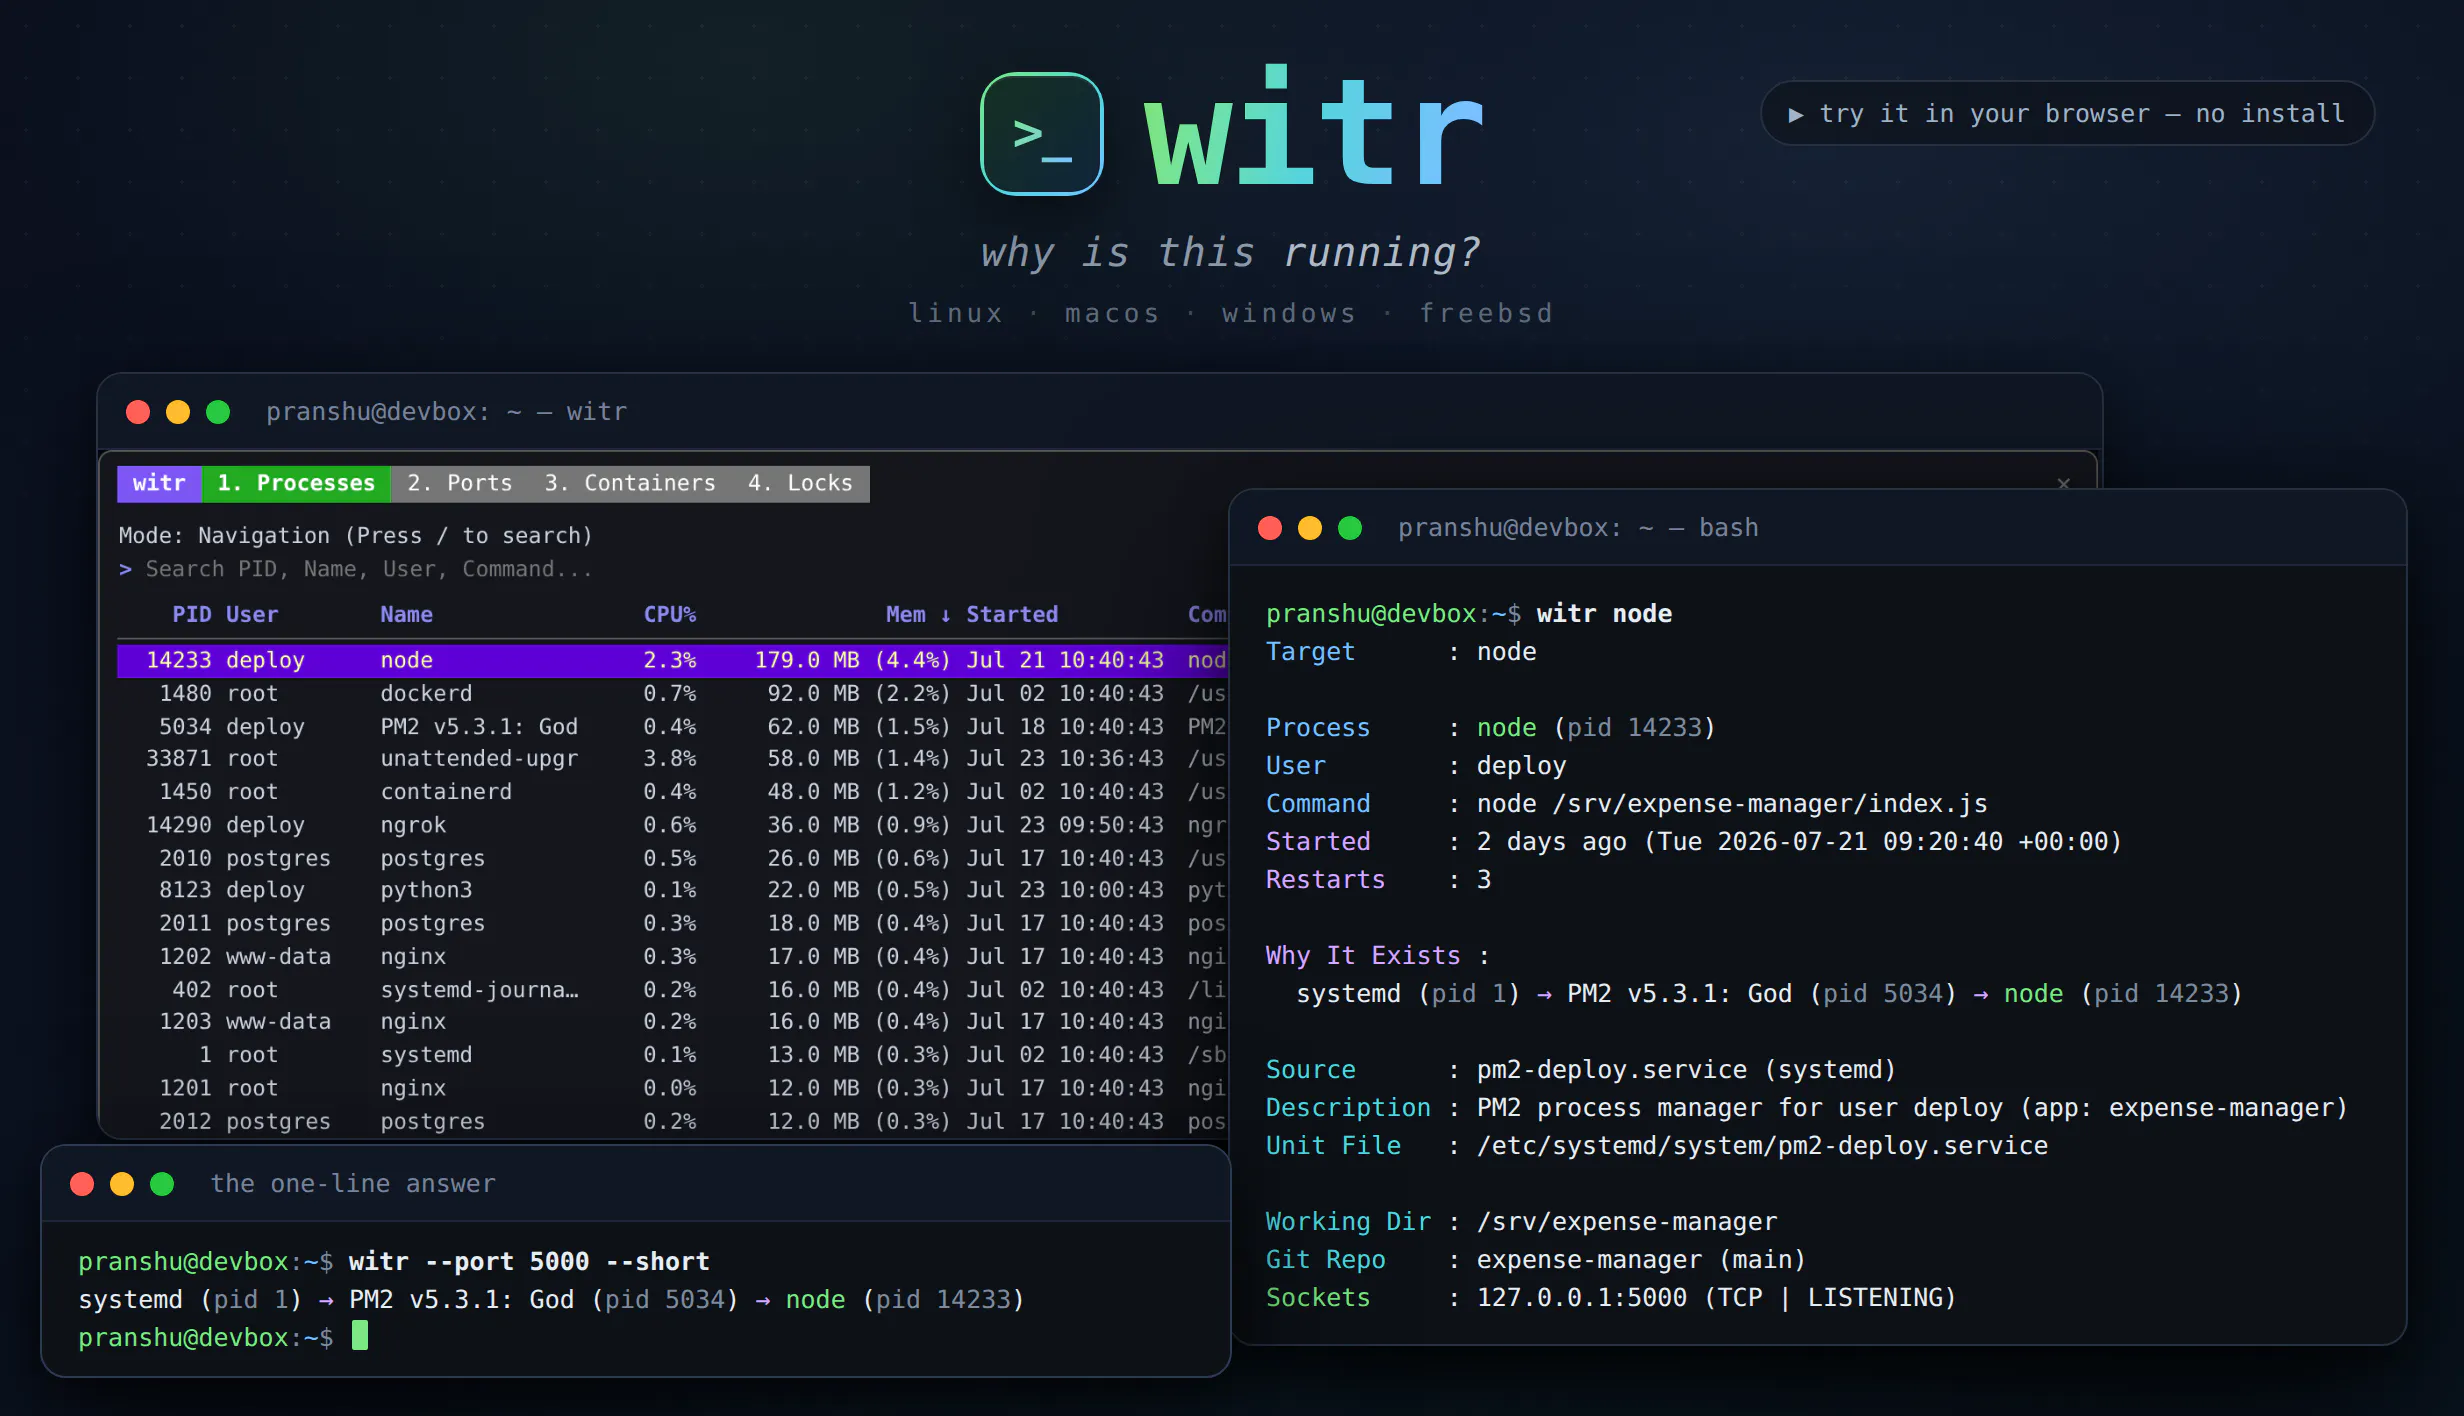
ps, top and lsof tell you what is running. witr tells you why. Point it at a process, PID, port, container or file and it traces the chain that explains it - systemd, supervisor, shell or cron - plus who started it, when, from where, and the warnings worth knowing. Run it bare for an interactive TUI with Processes, Ports, Containers and Locks tabs. Or script it: --short for a one-line chain, --json with real exit codes. One static Go binary for Linux, macOS, Windows and BSD.
AI Analysis
witr is an open-source CLI tool that traces why a process, port, container, or file is running, following the chain to systemd, supervisors, shells, or cron. It reveals who started it, when, from where, and relevant warnings. It features an interactive TUI with tabs for Processes, Ports, Containers, and Locks, plus scriptable outputs (--short, --json) with proper exit codes. Delivered as a single static Go binary supporting Linux, macOS, Windows, and BSD. It solves the pain of incomplete insights from ps, top, and lsof by providing full contextual 'why' explanations for better troubleshooting and system understanding.
In 2025-2026, rising adoption of cloud-native, containers, and complex distributed systems increases demand for advanced observability and debugging tools. Security audits, compliance, and AI-driven ops require clear process provenance. As DevOps practices mature and Linux/container usage grows, witr's tracing capabilities align perfectly with these needs. Excellent Timing.
High. Built as a lightweight single static Go binary with no external dependencies, it has low technical complexity, minimal deployment/operation costs, and high scalability across platforms. Open-source nature reduces compliance risks; cross-platform support and CLI model enable easy adoption and maintenance. Strong potential for community contributions.
Main targets: Linux sysadmins, DevOps engineers, backend developers, and security professionals working with servers, containers, and infrastructure. Industries: software development, cloud hosting, IT operations. Geographically global with concentration in tech hubs (US, Europe, China). Solves pain of opaque system states during troubleshooting. As free open-source, willingness to pay is low but possible for enterprise features/support; targets a growing but specialized devtools segment.
Low. Direct competitors: 1. lsof (https://linux.die.net/man/8/lsof), 2. pstree (https://man7.org/linux/man-pages/man1/pstree.1.html), 3. htop (https://htop.dev/), 4. systemd-analyze (https://www.freedesktop.org/software/systemd/man/systemd-analyze.html), 5. docker/podman inspect commands. Advantages: unified tracing across processes/ports/containers/files with full chain context, interactive TUI, JSON scripting, and multi-OS binary. Disadvantages: newer project, smaller community than established tools, lacks some specialized metrics of mature alternatives.
Upgrade Pro to unlock full AI analysis
Similar Products

Auriko
Trading desk for LLM calls
▲ 332 votes
Xirp
The agentic development environment built by Spotify
▲ 224 votes

React UI Kit V7
All the chat components you need. None of the complexity
▲ 115 votes

Replay QA Security Scan
Automated Penetration Testing for AI-Built Apps
▲ 102 votes

CodeBurn
See where your AI coding spend actually goes
▲ 101 votes

Blop
Describe your app and Blop tests it and repairs broken tests
▲ 80 votes